
Analytics Dashboard
Updated Dec 15, 2025
Monitor your support performance with real-time analytics.
Accessing Analytics
Click Analytics in the left sidebar to view your dashboard.
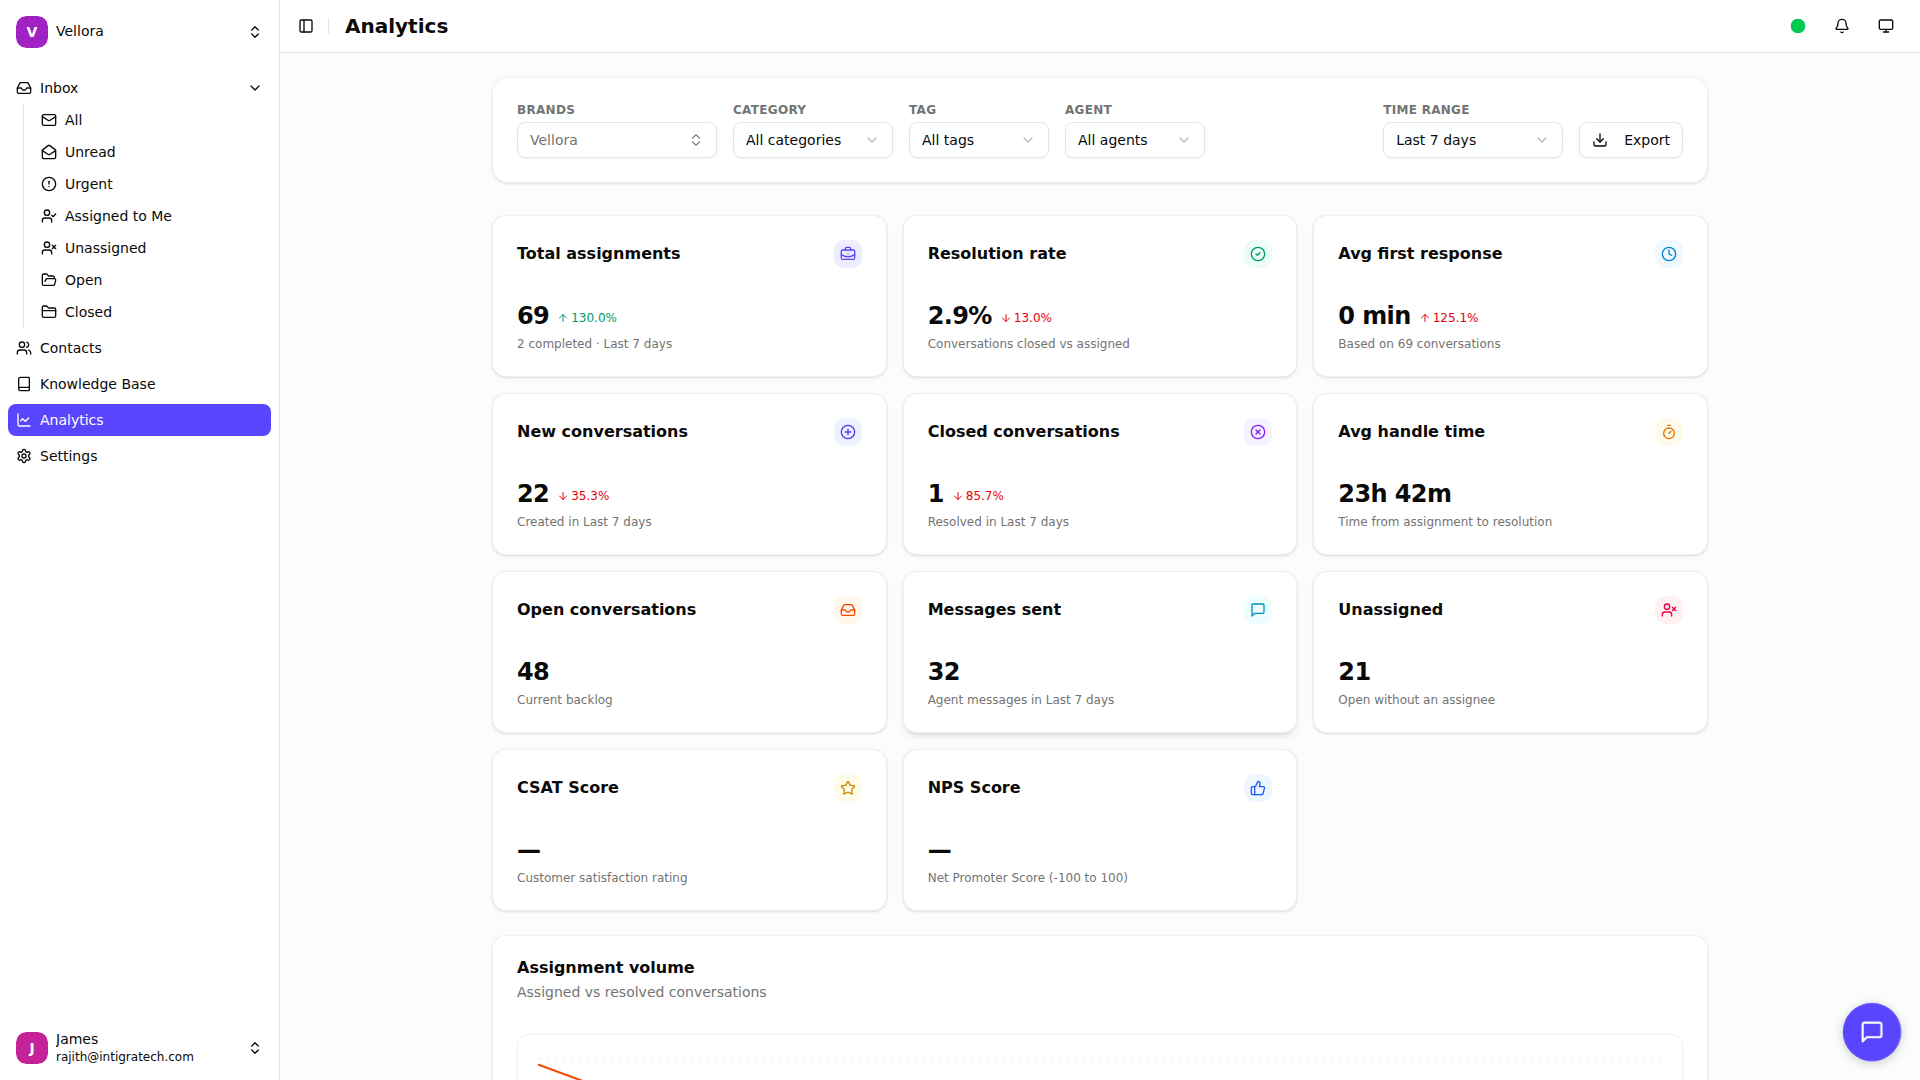
Dashboard Overview
The analytics dashboard shows three sections:
Assignment Metrics
Key performance indicators for your support team:
- Total assignments: Conversations assigned in the period
- Resolution rate: Percentage of conversations closed
- Avg first response: Time to first agent reply
- New conversations: Conversations started
- Closed conversations: Conversations resolved
- Avg handle time: Time from assignment to resolution
- Open conversations: Current backlog
- Messages sent: Agent messages in the period
Each metric shows a comparison to the previous period with trend arrows.
SLA Performance
Track your service level agreement compliance:
- Backlog by Priority: Open conversations by priority level
- SLA Compliance: Met vs breached targets for first response, resolution, and follow-up
Knowledge Base Performance
Measure your help center effectiveness:
- Published articles: Total live articles
- Article views: Total views recorded
- Helpful rate: Average helpful feedback
- Deflection rate: Self-serve resolution rate
Time Period Selection
Filter analytics by time range:
- Last 24 hours
- Last 7 days (default)
- Last 30 days
- Last 90 days
Select a range from the dropdown in the top right.
Filtering Data
Narrow your analytics with filters:
- Brand: Select one or more brands
- Category: Filter by ticket category
- Tag: Filter by conversation tags
- Agent: View specific agent performance